After China canceled the Zero-Covid policy, the official case growth data became invalid. How can we know whether a city has a mass infection now? Can the search index detect the spread of Omicron in China?
Looking at the google index related to “fever” in various East Asian regions that still monitor and report the number of positive cases, the search index is highly correlated with the local number:


We use “發燒” for Hong Kong and Taiwan, “fever” for Singapore, and “発热” for Japan. We can see that when these areas entered the stage of coexistence with the virus, the rise of the “fever” search index is basically in sync with the number of new local cases, or is about a week ahead.
Regarding the increase rate, except for the slightly misaligned first wave in Singapore, the growth of positive cases had similar patterns with the “fever” search index.
So, what are the “fever” search indexes in Chinese cities?
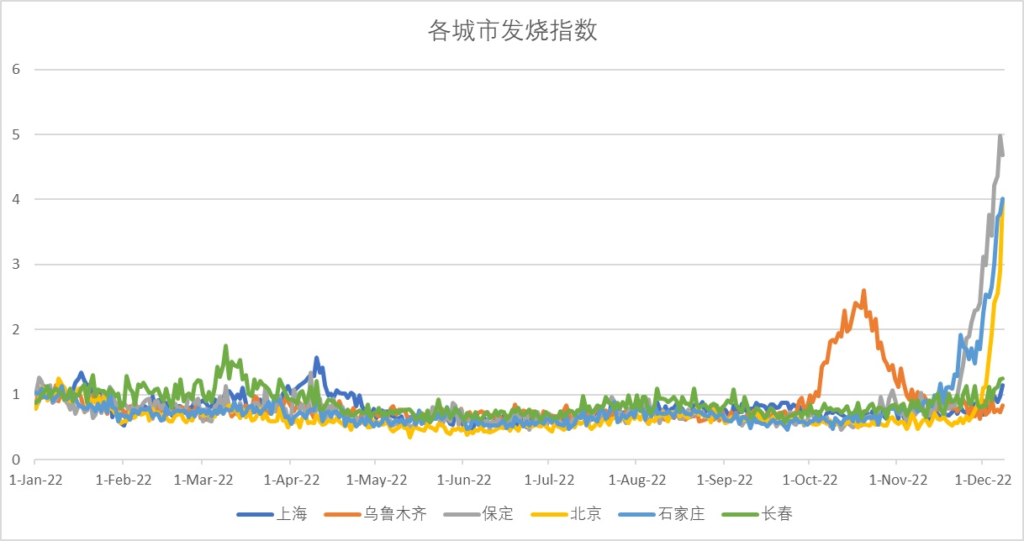
The figure below lists the “fever” search index for six Chinese cities, normalized based on the first two weeks of 2022 in each city.

It shows that Changchun and Shanghai had a short-term high in early March and early April, respectively. Changchun’s search volume for “fever” reached 1.74 times the benchmark level on March 9, and Shanghai’s came 1.57 times on April 10, the day with the most added infections in Shanghai.
Later, the “fever” index peaked in Urumqi in October, reaching 2.60 times the benchmark level. This period also overlaps with the time when the outbreak occurred in Urumqi. Urumqi’s “fever” search index is significantly higher than that of Shanghai and Changchun. That is to say, the actual number in Urumqi was far more than the officially reported cases. The long-term rotation stationed in Urumqi since October also proved this point from the side.
The examples of Shanghai, Changchun, and Urumqi show that the search index for “fever” correlates highly with the larger-scale Omicron outbreak. And when the number of official confirmed cases could not reflect the actual local state, the “fever” search index still faithfully presents the extent to which the epidemic has spread.
So, when we see that the “fever” index in Baoding, Shijiazhuang and Beijing has broken through 3 times, 4 times or even 5 times the benchmark value at an alarming rate, and there is no sign of stopping at all, what is the current situation in these cities? It is not difficult to imagine.
It should be noted that, up to now, most Chinese cities without mass infection have not yet experienced a rise in the “fever” index. So we believe that the policy changes don’t influence search index changes.
After analyzing the data of multiple cities, I tried to use the “fever” search index to give a signal of the beginning of the epidemic in each city, which includes two parts:
1. The average value of the “fever” search index in the past 7 days is greater than 2 standard deviations from the average value of the quarter in the past five years.
2. The Cox-Stuart test of “fever” search shows a significant upward trend at the 95% level. We used 7 days of data for the Cox-Stuart test here. The Cox-Stuart test needs to arrange the data in an interval in sequence, then take out all the pairs, look at the positive and negative conditions of these pairs, and judge whether there is a significant trend according to a binomial distribution.
When the above two conditions are both met, we define the first day of the upward trend as the first day when the city is experiencing a mass infection period.
Following this, we found a method that may predict the peak period of infection:
We assume:
- The search for fever is a stable proportion of the population with fever.
- The population with fever is a relatively stable proportion of the total population during the non-epidemic period.
Then we create a parameter S=∑ [(Fepidemic −Fnon-epidemic) / Fnon-epidemic ].
The average fever index during the non-epidemic period is Fnon-epidemic.
The search index during the epidemic period is Fepidemic.
S is proportional to the proportion of the infected population to the total population. We call it “excess fever search index cumulative area”
The figure below lists the “cumulative area of excess fever search index” in Taiwan, Hong Kong and Japan.

We found that in these three regions, when the epidemic peaked, the value of the “excessive fever search index cumulative area” all reached exactly 80. When the first wave of the epidemic ended, the area of Hong Kong reached 160, Taiwan reached 200, and Japan was 250.
What would be the result of doing the same research with the Chinese Local search index, Baidu? We used Shijiazhuang, Xingtai, and Baoding, the places where the group infection happened the fastest and earliest:

It is clear that the area of Shijiazhuang has reached 76, Xingtai’s has reached 67, and Baoding’s has reached 71. From this point of view, the cumulative area calculated by Baidu search index and Google index respectively is on a similar level.
Considering that the fever index in the three cities is still rising, as well as the difference between the Baidu search index and Google index, we conservatively assume 80 as the cumulative area of peak time, and assume 250 as the accumulated area of the end time.
Then we can calculate the peak time and end time in each city through the cumulative growth and speed of the fever search index.
This is the result, as of December 12th 2022.
Insufficient data, crude methods, reference only.
Original Blog : chenqin, https://zhuanlan.zhihu.com/p/590989182